Postman Pat Is Bad At His Job

“This would be a lot easier with a single-seat plane”
Photo by Cameron Gibson on Unsplash

Pat drives around with an unsecured animal with no thought to the safety of said animal or consideration for any allergies that may be present in his delivery population. An overreaction possibly, but it is becoming clear that the issue, unlike the cat, isn’t black and white. In the village of Greendale, there are 9 obvious children (33.3% of the total population). Based on a quick visual inspection, 5 of these children look more like Pat than they do their own parents. This is of course an unreliable indication, but it does raise suspicions that Pat may be delivering more than just the post. Of course, reducing the genetic variability of a fictional village in Cumbria doesn’t mean that Pat is a bad postman. Although observations of him opening other people’s mail, letting himself into homes uninvited and using a helicopter to get some balloons down from a tree provide hints that he is.

Postman Pat has not been associated with the Post Office and Royal Mail for a number of years. Despite the postal workers’ union describing the decision as a “disgrace” as Pat “stood for everything good about postmen”, Royal Mail dissociated themselves from him in 2000 as he was seen as no longer fitting with the company’s corporate image. That corporate image probably not including mistakenly giving a scarecrow a letter due to thinking it’s an actual human. Instead, Pat now runs a Special Delivery Service where he uses a high-tech command centre, limousine, snowmobile, single-seat plane, jeep, motorcycle, helicopter and bright red van to deliver the post to Greendale (population 27). That’s a bit unfair. He also occasionally delivers to Pencaster.

Pat is therefore in charge of a multi-million pound operation, more if you include the cat, and it’s probably worthwhile checking if he actually is as good at his job as his friends assume or if the occasional episodes of criminal behaviour mentioned hint at darker more incompetent possibilities.

“No burning letters behind me, no sirree.” Photo by Mofeda Dababo on Unsplash

I couldn’t get hold of the annual review specifications for Royal Mail as I am not employed there and the specifications for Special Delivery Service were not available due to it not being a thing. I could get the person specifications for what Royal Mail considers to be essential for a good postperson. These seem to be fair criteria against which to judge Pat’s competence. According to Royal Mail, a good postperson needs to:

  • Be upbeat and self-motivated
  • Love the outdoors
  • Have a good level of fitness
  • Be highly organised
  • Be resilient
  • Have flexibility within their role

A driving licence (with no more than 6 points) is also useful. Snowmobiles are not mentioned. To see whether Pat matches these specifications, I looked across the 196 episodes available and noted the occasions on which Pat displayed the required attributes.

Royal Mail also has targets for first class and special delivery. For example, in 2020, the target for mail delivered on time for first class and special delivery was 93.0% and 99.0%, respectively. While Royal Mail is the only UK mail delivery company required to publish Quality of Service performance against delivery targets every quarter, Pat basically lets us observe whether he meets these targets when working for Royal Mail or for Special Delivery Service, so his performance in this respect was also recorded (I checked how often his deliveries were on time).

There should be some caution in interpreting the results as it was just me doing the scoring so we can’t discount Confirmation Bias. These results were based on all of the episodes available to me (all of them) so we can sure we have reached data saturation. Another note of caution in interpreting these results is required as in most instances I read about the episodes rather than watching them due to reasons of time and my own wellbeing. Sadly, snow, rain, heat or gloom of night would have stayed this “researcher” in completing this “analysis”.

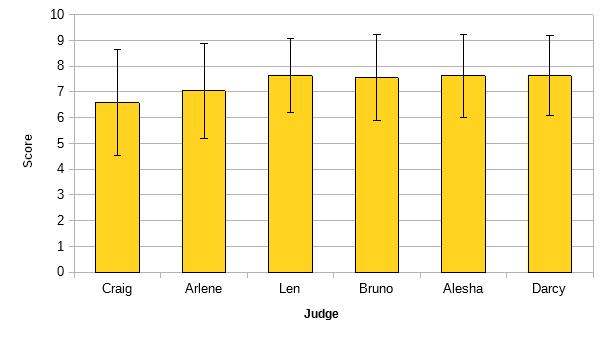
From the bar chart we can see that Pat does pretty well for being upbeat and showing a love of the outdoors. He scored comparatively low on organisation, fitness and flexibility. Presumably, he had a driving licence 100% of the time. There was no mention of his pilot’s licence.

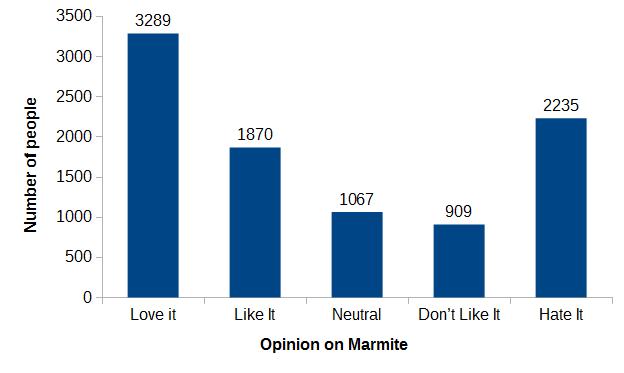
It’s a different story when we look at how often he delivered the mail on time. Here Pat falls well below the targets set by the Royal Mail. Like, so far below that it won’t be long before we’re watching Mole Person Pat. It is unknown what the targets for the Special Delivery Service are, but you would hope they were higher than what Pat is achieving.

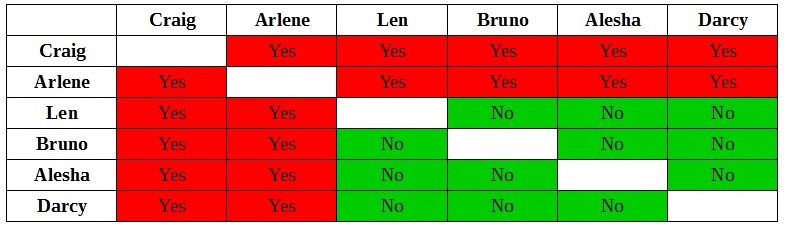
As shown below, these results are comparable when split by when Pat was working for Royal Mail and when he was working for Special Delivery Service. It could be argued that across several specifications, Pat appears to be performing worse numerically for Special Delivery Service than for Royal Mail. Despite millions of pounds worth of investment, Pat actually got worse at his job. Maybe we should change his name to Sunk Costs Pat.

Why then, is Pat still employed? In fact, in one episode he was actually given an award for the quality of his service! People obviously think Pat is good or at least competent at his job. But why?

I think what we are looking at is an example of the cognitive bias, the Halo Effect. The Halo Effect occurs when positive perceptions of something in one area influence perceptions in another area to be more positive. The classic example is where an individual is seen to be physically attractive and therefore assumed to also be a morally good person. In business, performance appraisal has been shown to be highly influence by the Halo Effect, as have results in trial by jury.

We can note that where Pat scores well against the ideal postperson specifications are in areas where you have to LOOK good at the job (upbeat, show a love of the outdoors), but that he doesn’t score so well against specifications where he has to BE GOOD at the job (organisation, flexibility, resilience, or coming within a million miles of meeting performance targets). The Halo Effect could mean that because Pat looks superficially good at his job, it will be assumed that he is good at his job. And then given a helicopter.

Overall, it’s unknown whether the Halo Effect is the main influence for Pat being bad at his job, but being perceived as good at his job. Future Postman Pat research might require a less obviously popular postman, perhaps Cliff Clavin from Cheers, for comparison of perceptions versus fictional postperson effectiveness. However, it is clear that fictional postmen do well with the Halo Effect as Moist von Lipwig, a postmaster from Terry Pratchett’s Discworld series, was very well thought of based on his charm and a gold suit. Although the comparison between Moist and Pat ends here as Moist actually ran a very effective postal service, whereas Pat might as well take everything with a stamp and kick it into a ditch. It’s OK though. Pat feels he’s a very happy man.

Don’t get me started on Fireman Sam.

Why Pudsey Bear is Awful: This story. AGAIN.

Acceptable generic injury bear

It’s the most wonderful time of the year. Though people can’t leave their dwellings, I’ll still be retelling why I hate a bear. It’s the most wonderful time of the year. It has been 40 years since Children in Need began and Pudsey Bear is still awful. I have no particular opinion about Blush.

Some people who know me (let’s call them friends, despite their arguments) state that they wouldn’t feel that Children in Need was complete without me telling them about why I dislike Pudsey Bear. They’re humouring me of course, but humouring me represents 97% of the work of being my friend, so that’s fine.  My apologies if you started reading this for some reasoning behind why Children in Need as a charity is still important (some of that later), some psychology of altruism (some of that later) or a serious exposé of some behind the scenes scandal (none of that later). I’m afraid my story is still just a short, bitter, pointless grudge against a monocular bear.

As a much younger man, a CHILD you might say, I had been unwell and as a result had been to the see a doctor. I can’t remember what the illness was. Possibly news had spread about the time I asked the biology teacher why they directly taught us about diffusion instead of letting the idea spread out to us gradually and the medical profession were worried my body was degrading due to being too cool.

After leaving the clinic, in fact just outside the clinic, I fainted. On my trajectory towards the ground, I decided it would be safest if my head should take a slight detour towards the wall, using the bricks to cushion the blow and add a jaunty angle to the proceedings. I broke my glasses too, so that was a bonus.

Artist’s recreation of the event

As I lay there regaining consciousness, bewildered and pathetic, head hurting and glasses broken, I notice a blurry figure approach out of the blurry distance into the slightly less blurry foreground. It was Pudsey Bear! He was obviously out collecting money for Children in Need that being the time of year it was and the main thing that he is into. I was saved! Who better than the mascot of Children In Need to help a child, in need, outside a healthcare professional’s building? Pudsey stepped over me and carried on walking.

I’m not a fan of Pudsey Bear.

“Perhaps Pudsey didn’t see you, his vision can’t be that good.”

“Why did he step over me then instead of tripping over me and landing beside me on the pavement?”

I’m not a fan of Pudsey Bear.

Psychological studies into altruism have demonstrated that whether someone stops to help someone else is influenced by a number of factors. For example, if people feel they are short of time, see someone is bleeding, think there are lots of people around so one of them will help instead  (diffusion of responsibility) or simply don’t identify with the person who needs assistance, then they are much less likely to engage in altruistic behaviour (the bystander effect).

Perhaps Pudsey was late for an important bear appointment, was put off when he saw I was losing haemoglobin, thought one of the other people would help me and noticed I wasn’t a bear like him, so didn’t help. Perhaps Pudsey’s just awful.

I’m not a fan of Pudsey Bear.

Acceptable bear demonstrating the bystander effect. Probably.

However, Children in Need do take part in good work that shouldn’t be necessary. Recently, you will have no doubt heard about or experienced the negative impact of lockdown on children’s mental health. Some research suggests that as a result of increased social isolation and the loss of the normal structure of their lives, a large number of children experience disturbed sleep, nightmares, poor appetite, agitation, inattention and separation-related anxiety. Even during this second lockdown, despite schools remaining open, lessons and daily structure are disrupted due to social bubbles being sent home with positive COVID-19 cases and due to teachers being absent with infection or instructed isolation. Some stress is important for healthy psychological development, but intense, frequent or prolonged “toxic” stress can lead to cognitive impairment and stress-related disease. So children suffer with isolation if schools are closed due to lockdown, but suffer due to lack of structure if schools are open but continually disrupted, for example, if they had been made to stay open for political reasons rather than being given time to come up with a blended approach that works well for pupils and staff. Or something. Regardless, children will suffer. Children In Need do a reasonable amount to assist children with mental health difficulties, so maybe donate?

Or there are lots of other good charities, so you can pick one of them if you like. You might as well, otherwise reading this stupid story about my ridiculous grudge against a visually-impaired ursine has been a complete waste of time.

Blue Tuesday: Is there too much work against Blue Monday?

60_jahre_allgemeine_erklarung_der_menschenrechte_3084670759

This bear is leaving home because its owners believe that Blue Monday has a scientific origin. (Attribution)

Yesterday wasn’t Blue Monday. Or to use its full name, Blue Monday (A Normal Day Of The Year Which Was Rebranded Through Marketing With A False Veneer Of Misleading Science). Blue Monday (ANDOTYWWRTMWAFVOMS) became a “not a thing” which happens as a result of holiday sellers, Sky Travel, and public relations company, Porter Novelli, selling holidays and public relating. They invented a formula which supposedly calculates that the third Monday in January is the most depressing day of the year and stuck what looks like a scientist on the front to complete its fancy-dress costume of sexy fake science concept. Needless to say, the average mood of everyone is too complex a thing to calculate with the simple equation being touted. Saying it can is a horrendous misrepresentation of the scientific method, human emotions and mental health. The added scientist, Cliff Arnall, is not a doctor or a professor of psychology. Or of anything. Saying he is is…

It’s difficult to argue with the success of the Blue Monday (ANDOTYWWRTMWAFVOMS) idea as a piece of marketing. On the day itself, the number of companies, including charities, that use the term to promote their products or causes is vast. With the general theme of spending money to improve your mood, Blue Monday (ANDOTYWWRTMWAFVOMS) is used to sell pretty much everything; be that the holidays it was designed to sell, cars, chocolate or financial advice. Perhaps more subtly, some groups have tried to re-purpose Blue Monday (I’ll stop now). They argue that while the supposed science might be a gargantuan heap o’ nonsense, it can still be a day to consider and support those who are unhappy. In addition, a lot of people have put a lot of work into explaining why, as a scientific concept, Blue Monday has the same credibility has half a brick with a picture of Dr Emmett Brown sneezed onto it by a guinea pig. So much so, that the publication of pieces debunking the science of Blue Monday have become as much of a tradition as the shower of gaudy sadverts.

kiara

This dog is more scientific than the formula for Blue Monday. (Attribution).

For the last few years, I have gained the impression that the pieces attempting to counteract the Blue Monday information have become more common than the items using its selling power. If this was indeed the case, the main thing keeping Blue Monday alive would be the valiant efforts to kill it. This could be placed in the Venn diagram of ironic things and bad things. However, whether this is the case is far from decided. While I have seen the same claim from others, my perception that anti Blue Monday work is more common than pro Blue Monday work is just that, a perception. Perceptions are at risk of bias.

Confirmation bias would mean that I might be interpreting information in a way that confirms my pre-existing beliefs. All the evidence I’ve seen shows that confirmation bias exists. The Baader-Meinhof phenomenon (or frequency illusion) would mean something that’s recently been noticed by me, suddenly seems to occur at a greatly increased rate. Once you’ve noticed the Baader-Meinhof phenomenon, you’ll start seeing it everywhere. Finally, the perception that anti Blue Monday work is more common than pro Blue Monday work might be the result of an echo chamber. I’m more likely to associate (digitally or in the great outdoors) with people who hold similar points of view to me. I’ll therefore see opinions the same as mine with greater frequency, and if I’m not careful will come to believe that those opinions are the most common. Everything I’ve seen on Twitter confirms I’m right.

One potential antidote to the plethora of human bias is correctly analysed data. I didn’t have that, so I took to the internet. On 16th January 2017, I searched for the term, “Blue Monday” on Twitter. I didn’t specifically use the hashtag because I wanted to avoid people or organisations using it just to make their tweets more locatable on the specific day. On a separate note, SEX! I then counted the tweets that seemed to believe the effect of Blue Monday, the tweets that actively opposed the effect of Blue Monday, and the tweets that didn’t believe Blue Monday, but wanted to use it to at least gain some benefit. I did this until the total tweets I’d counted reached 100. To be counted, a tweet had to at least hint at belief in Blue Monday or otherwise. It couldn’t just spout a load of a nonsense about sofas and then end with a hashtag. I also did a similar thing with Google (incognito window to avoid the influence of my search history) to count sites, news items, blog posts etc. and place them in the same categories as were used for the tweets. This was also completed when the total links reached was equal to 100. I later checked the Google search o a separate device and found the resulting list to be practically the same.

The results can be seen below. In summary, the pro Blue Monday items were much greater in the number than the anti Blue Monday items. These were both much more prevalent than items trying to re-purpose the day. My perception was wrong, and unfortunately the work to demonstrate that the idea of Blue Monday is anti-scientific rubbish appears to still has some way to go.

blue-pie

Pie part showing the proportion of pro Blue Monday, anti Blue Monday and re-purposing Blue Monday items.


One thing to note however, was that out of the pro Blue Monday items, 72% were advertisements. As discussed, these would make the argument that it’s the saddest day of the year so why not buy chocolate/hair gel/happiness? It is unclear to what extent the people behind these believe that Blue Monday was a scientific concept. While their adverts vaguely hint at belief, it’s just as likely that the mention of Blue Monday and its supposed effects are being used as devices to enhance how noticeable their brand is on a specific day. An increasingly difficult task given how common the use of the Blue Monday “brand” is. It seems to me that an advert that went with something other than Blue Monday marketing on the third Monday in January would be the one to stand out.

I’m not sure why efforts to educate people as to the non-scientific origins of Blue Monday are not working or even if they are actually not working in the first place. As discussed, it’s possible people know all of this, but find the term useful for their purposes; whether these are charitable or otherwise. Indeed, some news outlets may be using anti Blue Monday work to join in and take advantage of the temporary interest while maintaining an appearance of credibility. There’s no point in having your cake if you can’t eat it.

Ultimately and unfortunately, it appears that not much can be done about the Blue Monday juggernaut. I might still hold out hope for those valiantly explaining the gibberish behind the claims and even for those re-purposing the day for more noble causes. Judging by the current proportions, these efforts need to increase or change their methods to become more effective. How? I don’t know, although at least I’ve got nearly a year to think about it.

One thing you can do is donate to/support/um… those things, the Rethink Blue Monday campaign to raise awareness for the real issues of mental health and why blue Monday is, to use a polite phrase, factually faecal. The link is here.

https://www.gofundme.com/f/rethink-blue-monday?utm_source=customer&utm_medium=copy_link-tip&utm_campaign=p_cp+share-sheet

Why is early Christmas so annoying?

old_christmas_riding_a_goat_by_robert_seymour_1836

Christmas riding an annoyed goat. By Robert Seymour (1798 – 1836) [Public domain], via Wikimedia Commons

Writing about Christmas getting earlier every year gets earlier ever year. Complaining about shops putting out their Christmas items when the Easter items are still egging up the shelves, howling in pain when I Wish It Could Be Christmas Everyday starts playing on Groundhog Day, and grumbling as your appointment card for your annual infusion of Will Ferrell’s Elf arrives in July has almost become a festive tradition. So called, ‘Christmas Creep’, the aforementioned phenomenon whereby retailers introduce their Christmas-based merchandise or decorations in advance of what would traditionally be viewed as the start of the Christmas period is widely considered to be pretty annoying. Almost as annoying as mince pies being on sale so early that their best before date is well before December. Although, not as annoying as the fact they didn’t call Christmas Creep ‘Premature Elf Adulation’. Overall it wouldn’t seem to be too much of stretch to say that early Christmas is considered to be a source of annoyance, but what are the reasons for this?

Annoyance is relatively poorly researched in psychology compared to emotions such as happiness, anger or disgust with Piers Morgan. As is often the case in psychology, there isn’t even a clear consensus as to what annoyance actually is. Therefore, which theory regarding the cause of annoyance we use will depend on how we define annoyance itself. Some have chosen to define annoyance as a type of stress, some as a mild form of anger, and some as a distinct cognitive process or emotion in its own right, which nonetheless is very similar to slight anger. This is ironically irritating.

Briefly, a common definition of stress is when resources (physical or psychological) are exceeded by the demands on those resources. Lazarus, and Launier stated that psychological stress is the consequence of an individual’s inability to cope effectively with environmental demands. For example, experiments from 1971 demonstrated that people who knew that they could eventually stop a stressful noise or knew when a stressful noise would stop experienced fewer stressful effects than people who didn’t have this knowledge. If you were forced to watch The X Factor and didn’t know when the Cowelly cacophony would end, then a stress response would result. In terms of early Christmas, stress and annoyance could be related to uncertainty as to when holiday demands (shopping, social obligations to family and friends, pressure to enjoy Home Alone) will start and finish, and whether those demands can be met. While the stress of Christmas is undoubtedly a real phenomenon and we could see how a prolonged state of Christmas could increase this stress, intuitively this emotional response seems difference to annoyance.

Anger in general has been more widely studied than annoyance and has been described across most cultures and multiple species. The recalibration theory of anger argues that the function (in evolutionary terms) of anger is to promote the resolution or recalibration of undesirable situations in favour of the individual experiencing anger. Anger occurs when something is wrong and needs to be changed. You are between me and some food/ a potential mate/not having my opinion unchallenged on social media and anger mobilises psychological and physical resources for me to try to correct that. Whether that thing can be changed or not is another story entirely. Early Christmas may be viewed by some as an out-of-place environmental stimulus, resulting in anger and a desire to change or avoid this misplaced jolliness. Someone shouts ‘bah’ at you, and you respond with a ‘humbug’.

glowballs_in_roundabout_avesta

A load of Christmas balls. By Calle Eklund/V-wolf (Own work) [GFDL (http://www.gnu.org/copyleft/fdl.html) or CC BY 3.0 (http://creativecommons.org/licenses/by/3.0)%5D, via Wikimedia Commons

In keeping with the view of anger as evolved survival mechanism, which is now being applied to novel social and cultural situations, researchers such as Garrity and Cunningham have argued that annoyance is the emotional version of a withdrawal reflex. In the same way that a fly responds to a noxious stimulus by trying to avoid or move away from it, humans experience an emotion in response to a potentially ‘damaging’ situation, with this annoyance acting as a motivation or signal to withdraw from or stop the experience. This hints that for something to be annoying, some aspect of it must defy expectations. A large part of what the human brain does is to identify and seek predictable patterns. In fact, it (you) often recognises patterns where none exist. Where an environmental stimulus does not fit a pattern (I’m not normally covered in bees), it demands attention and depending on the nature of the stimulus should be avoided or stopped. As such, for a situation or behaviour to be considered annoying, it likely has three qualities: unpredictability, of uncertain duration, and experienced as unpleasant.

Moreover, behaviours that could potentially cause annoyance have been categorised into four groups of ‘social allergens’ based on how intentional they are and how specifically they are aimed at the person experiencing annoyance. These don’t necessarily explain why behaviours are annoying, but do allow some more precise description of annoying situations. The four groups of social allergens include:

  • Uncouth actions/impolite personal habits (unintentional and undirected) – the person on the bus picking their nose and sticking the nasal treasure to the window
  • Inconsiderate activities (unintentional and directed) – the person who was supposed to meet you on the bus, but is late
  • Rule breaking (intentional and undirected) – the person smoking on the bus
  • Intrusive behaviours (intentional and directed) – Katie Hopkins telling you her opinions on the bus

OLYMPUS DIGITAL CAMERA

Look, glitter! Buy stuff! By Iamraincrystal (Own work) [CC BY-SA 3.0 (http://creativecommons.org/licenses/by-sa/3.0)%5D, via Wikimedia Commons

Which social allergen could an early Christmas be categorised as? There are several reasons people give for finding the early celebration of Christmas annoying. Many feel that the extended displays of Christmas behaviour are a sign of increasing commercialisation of the holiday, which is annoying in itself, and argue that this encroaches on family- and religious-based reasons for festivity. Additionally, a reasonable proportion of complaints against earlier Christmas relate to a dislike of emotional manipulation that they feel is being directed towards them by companies, organisations and saccharine relatives. In related reasons, some people argue that having the Christmas period start earlier and take place over a longer period of time dilutes and removes the specialness. Others state that having Christmas ‘start’ earlier is against the traditions associated with Christmas. The behaviours can be considered intentional in that retailers mean to be putting out their stock and decorations (they didn’t sneeze and accidentally spray tinsel everywhere). The level of direction is debatable. Christmas stock is basically aimed at everyone without being targeted at individuals and as such is fairly undirected. However, Christmas advertisements and items tend to have demographics they are aimed at giving them a modicum of direction. Overall we can classify the annoyance of early Christmas as an example of rule breaking and as an intrusive behaviour.

In summary, it would seem that psychologically, early Christmas can be classified as an intrusive behaviour and as an example of rule breaking. People experience this as an unpleasant collection of environmental stimuli that they weren’t predicting to occur yet and don’t know how long will last. Annoyance is then experienced as a mild form of anger to mobilise physiological and psychological resources for the avoidance of these stimuli.

The cingulate cortex is a part of the limbic system which has generally been associated with the formation and processing of emotions, learning and memories. MRI studies suggest that the cingulate cortex is involved with annoyance, noting a positive correlation between blood flow to this area of the brain and the level of irritation. Other brain areas implicated in the feeling of annoyance are the hippocampus (consolidating memories of annoyance with early Christmas from short- to long-term) and the amygdala (forming and retaining emotional memories of how annoying early Christmas is). However, the list of emotions and functions these brain areas have been associated with isn’t getting any shorter (I checked it twice), so any understanding of a neurological basis for annoyance with early Christmas is basically non-existent. While it can be helpful to know that theories can be applied to a wider range of relevant phenomenon, there’s no evidence for any of this with regards to why early Christmas is annoying and research probably isn’t forthcoming. This means this entire article is basically a Just So story (or Just Ho Ho Ho story if you prefer). How annoying.

How unreliable are the judges on Strictly Come Dancing?

the_strictly

That very clean glass wall won’t hold itself up. Photo by Dogboy82 – Own work, CC BY-SA 4.0, https://commons.wikimedia.org/w/index.php?curid=44203685

Strictly Come Dancing, one of the BBC’s most popular shows involving celebrities moving in specific ways with experts at moving in specific ways while other experts check if they’re moving specifically enough contains certainties and uncertainties. We’re not sure who will be voted out in any particular week. We don’t know know what the audience are going to complain about. An injured woman not dancing! I was furious with rage! We do know that Craig Revel Horwood will use the things he knows to make a decision about whether he likes a dance or not while saying something mean. We can be pretty sure what Len Goodman’s favourite river in Worcestershire, film starring Brad Pitt and Morgan Freeman and Star Trek: Voyager character is. But can we be sure that the scores awarded by the judges to the dancers are accurate and fair?

In science, a good scoring system has at least three qualities. These include validity (it measures what it’s supposed to measure), usability (it’s practical) and reliability (it’s consistent). It’s difficult to assess the extent to which the scoring system in Strictly Come Dancing possesses these qualities. We don’t really know the criteria (if any) that the judges use to assign their scores other than they occasionally involve knees not quite being at the right angle, shoulders not quite being at the right height, and shirts not quite being able to be done up. As such, deciding whether the scores are valid or not is tricky. The scoring system appears to be superficially usable in that people use it regularly in the time it takes for a person to walk up some stairs and talk to Claudia Winkleman about whether they enjoyed or really enjoyed the kinetic energy they just transferred. In some ways, checking reliability is easier. Especially if we have a way to access every score the judges have ever awarded. And we do. Thanks Ultimate Strictly!

For a test to be reliable, we need it to give the same score when it’s measuring the same thing under the same circumstances. If the same judge saw the same dance twice under consistent conditions, we’d expect a dance to get the same score. This sort of test-retest reliability is difficult to achieve with something like Strictly Come Dancing. The judges aren’t really expected to provide scores for EXACTLY the same dance more than once. Otherwise you’d end up getting the same comments all the time; which would be as difficult to watch as the rumba is for men to dance. Ahem. However, you can look at how consistently (reliably) different judges score the same dance. If all judges consistently award dances similar scores, then we can be more sure that the system for scoring dancing is reliable between raters. If judges consistently award wildly different scores for the same dances, we might be more convinced that they’re just making it up as they go along, or “Greenfielding it” as they say in neuroscience.

To test this, all scores from across all series (except the current series, Christmas specials and anything involving Donny Osmond as a guest judge) were collated and compared. Below, we can see that by and large the judges have fairly similarly median scores (Arlene Phillips and Craig = 7, Len, Bruno Tonioli, Alesha Dixon and Darcey Bussell = 8). The main differences appear to be in the range of scores with Craig and Arlene appearing to use a more complete range of possible scores.

strictly-box-plot

Box plot (shows median scores, inter-quartile ranges, maximum and minimum scores for each judge)

A similar picture is seen if we use the mean score as an average, with Craig (mean score = 6.60) awarding lower scores than the other judges, whose mean scores awarded range from 7.05 (Arlene) to 7.65 (Len and Darcy). Strictly speaking (ironically) we shouldn’t be using the mean as an average for the dance scores. The dance scores can be classified as ordinal data (scores can be ordered, but there is no evidence that the difference between consecutive scores is equal) so many would argue that any mean value calculated is utter nonsense meaningless not an optimum method for observing central tendency. However, I think in this situation there are enough scores (9) for the mean to be useful; like the complete and utter measurement transgression that I am. At a first glance, these scores don’t look too different and we might consider getting out the glitter-themed cocktails and celebrating the reliability of our judges.

strictly-bar-chart

Bar chart showing mean scores and variance for each judge.

In order to test the hypothesis that there was no real effect of “judge” on dance scores, I did a statistics at the data. In this case a Kruskal-Wallis test because of the type of measures in use (one independent variable of ‘judge’ divided into different levels of ‘different judges’ and one independent variable of ordinal data). And yes, it would be simpler if Kruskal-Wallis was what it sounded like, a MasterChef judge with a fungal infection. Perhaps surprisingly, the results from the test used could be interpreted as showing that the probability that the judge doesn’t affect the score was less than 1 in 10,000 (P< 0.0001). The table below shows between which judges the differences were likely to exist (P< 0.0001 for all comparisons shown as red).

strictly-table

Table showing potential differences between judges in terms of scores they give to dancers

Thus it would seem that the probability that Craig isn’t have an effect on score is relatively small. In this instance, Craig appears to be awarding slightly lower scores compared to the other judges. The same could be said for Arlene, except if she is being compared to Craig, where she seems to award slightly higher scores.

So it transpires that the scores on Strictly Come Dancing are indeed unreliable. Arlene did and Craig is throwing the whole system out of alignment like a couple of Paso Doble doing a Jive at a Waltz. Tango!

Possibly not though, for a number of reasons. 4.) I am clearly not an expert in statistics, so I may have just performed the analysis incorrectly. 2.) If differences do exist, they are relatively subtle and are likely to be meaningless within individual shows, only coming to light (and bouncing off a glitter ball) when we look across large numbers of scores. That is to say, that a statistical difference may exist, but this difference likely makes no practical difference. A.) At least it’s not The X Factor.

Keep dancing. And doing maths.

Marmite: checking whether it really is a love or hate relationship

marmite_pop-up_shop_in_2009

What do you get for the person who has everything? And who you also hate? By Gilda from London, UK (Marmite pop-up shop Uploaded by Edward) [CC BY-SA 2.0 (http://creativecommons.org/licenses/by-sa/2.0)%5D, via Wikimedia Commons

Jokes about Marmite; most people don’t have strong responses to them. This is unlike the recent news that as a result of potential Marmite price rises, one supermarket might have stopped stocking it. It was generally reported that people were furious with rage, which continued when the dispute was resolved approximately 24 hours later. And because it was opinions on the internet, people said that those opinions were wrong. And because it was definitely opinions on the internet, people went out of there way to say how little they cared about the issue. Whatever your thoughts regarding this particular spread, it’s difficult to deny that the specifics of its one “you either love it or hate it” advertising slogan have been pervasive. So much so that the name ‘Marmite’ is almost synonymous with something which polarises opinion. It’s a real Marmite situation. But what’s the question at the end of the first paragraph that reveals what the rest of the blog post is about? And is it true that people either love or hate Marmite, with no place for yeasty apathy? Luckily, surveys, maths and toast could be used to check.

The information regarding people’s opinion on Marmite was taken from the YouGov UK website. According to this website, YouGov survey approximately 5 million online panellists from across 38 countries including, among others, the UK, USA, Denmark, Saudi Arabia and Europe and China. They claim that their panellists are from a wide variety of ages and socio-economic groups, allowing them to create online samples which are nationally representative. The UK panel, from which the data used here were taken, includes more than 800,000 people. So essentially I went to the YouGov UK website, searched for ‘Marmite’ and took the numbers regarding what the people sampled thought of it. And ate some toast.

marmite-1

Figure 1. Numbers of people with certain opinions regarding Marmite.

Figure 1 shows the number of people who reported that they loved, liked, felt neutral about, didn’t like or hated Marmite. The actual YouGov website actually shows picture representations of heart, smiley jaundice face, straight-mouth jaundice face, sad jaundice face and angry rosacea face that I interpreted to mean the aforementioned categories. I’m good at emoticons; sideways punctuation smiley face.

You can see that the two tallest bars are for Love It (3,289 people) and Hate It (2,235 people), followed by Like It (1,870 people), Neutral (1,067 people) and Don’t Like It (909 people). However, these aren’t necessarily the groups we’re interested in. The claim is that people either love or hate Marmite. Figure 2 shows the number of people of love or hate Marmite (Love It plus Hate It) and the number of people who don’t feel that strongly about it (Like It plus Neutral plus Don’t Like It). Of the two populations, Love It or Hate It (5,524 people) is larger than Don’t Feel That Strongly (3,846 people). This is perhaps shown more intuitively in Figure 3, where it is depicted that compared with people who don’t feel that strongly about Marmite, 17.9% more people love or hate it.

marmite-2

Figure 2. Numbers of people who love or hate Marmite and who don’t feel that strongly.

The presence of a group of people that don’t feel that strongly about Marmite would seem to contradict the idea that there are only two populations with respect to Marmite desire. However, it could be argued that we are really examining the effect of Marmite on Marmite apathy. Does Marmite have an effect on whether you love or hate it or don’t feel that strongly about it? What is the probability of this many people loving or hating Marmite if Marmite doesn’t make you love or hate it?

marmite-3

Figure 3. Proportions of people who love or hate Marmite and who don’t feel that strongly.

As this was a single population (people who give their opinions to YouGov UK) and we are looking at two possible categories within that population (Love It or Hate It and Don’t Feel That Strongly About It), I used a binomial test to determine the probability that there was on effect of Marmite on Marmite emotiveness. This demonstrated that the chances of this many people loving or hating Marmite if Marmite doesn’t make you love or hate it was at least 1 in 100,000,000 (P<0.00000001). Depending on your threshold for such things, this would seem to be reasonable argument that Marmite has a tendency to make people feel strongly about it.

There are some potential problems with this reasoning. Firstly, the analysis could be wrong. I’m far from an expert in statistics, and it’s entirely possible that I performed the wrong tests or interpreted the results incorrectly. While eating toast.

Secondly, these data only covers people who provide information to YouGov UK. While YouGov UK would certainly claim that they are representative of the whole population, we can’t know this for sure. The same YouGov UK page claims that being a Marmite customer correlates with having gardening as a hobby and being a customer of Waitrose, and I can count on the finger of know hands the number of times I’ve seen someone pruning the roses, while eating a Marmite sandwich and some Waitrose pickled quail eggs. This is a real product, although I think it’s cruel to pickle quails. Although, that’s not really the issue. Ultimately, there might be something different about the people who report to YouGov (such as a tendency to feel strongly about yeast-derived devil’s treacle) compared with the general population, and we can’t know that just from these results. Basically we’re saying that these results may be influenced by self-selection bias.

marmite_packaging_uk_2012

Well, what would you have put a picture of? Photo licensed under the Creative Commons Attribution-Share Alike 3.0 Unported license.

When people are in groups, their opinions and behaviour have a tendency to be more extreme than when they are acting as individuals. This is known in psychology as group polarisation. For example, if you have racist and sexist attitudes and join a group with racist and sexist attitudes, your racist and sexist attitudes will worsen; the group influence will trump your own lesser tendencies. Ahem. This process has also been seen to occur through social media, even though people aren’t physically interacting as groups. Observed over time on Twitter, discussion regarding political issues with like-minded individuals becomes more homogeneous and more extreme. In this instance, the hypothesis is that people identify with others who have a similar opinion to theirs regarding Marmite, and over time polarise that existing opinion until they state that they love or hate it. In reality, the truth is closer to a more moderate Marmite approval or disapproval. However, the online poll doesn’t involve group discussion and polls are completed anonymously, so even if people are basing part of their social identity on how much they enjoy a salty brown loaf goo, group polarisation seems unlikely.

Of relevance here may be a type of response bias called, ‘extreme responding’. This is a tendency for people to select the most extreme responses available to them and usually depends on the wording of the question, but has been linked to age (younger = more extreme), educational level (lower = more extreme) and cognitive ability (lower = more extreme). We don’t know how the poll was worded or the composition of the poll responders, so speculation as to the extent of extreme responding is fairly pointless even though it DEFINITELY HAPPENED!

Alternatively, the well-known advertising for Marmite may have introduced another kind of response bias called ‘demand characteristics’. Here, participants in an experiment or survey change their response because they are in an experiment or survey. This is assumed to be an attempt to comply with what they believe the aims of the experiment to be. Respondents asked about Marmite may be more likely to give an extreme response based on the advertised ‘consensus’ that people either love or hate Marmite. And so the opinion spreads like a pun-based analogy.

Finally, it could actually be the case that Marmite has such a distinct flavour that people really are more likely to have an extreme response than an ambivalent one. Although at this stage you may have stopped caring. I prefer jam anyway.